

Quality Control or reviewing the schedule quality before the scheduler submits their schedule to the client (either it is the contractor, consultant, or client) is very important to avoid any inaccurate information such as wrong start dates, sequence of work, and project critical path. Having a low-quality schedule would affect the essence of the schedule and will lead to some consequences or delays in the project timeline.
This is Part 2 and continuation of my earlier blog Quality Control in Construction Schedules – Part 2
What are the 14 steps for ensuring quality control in a construction schedule?
- Logic
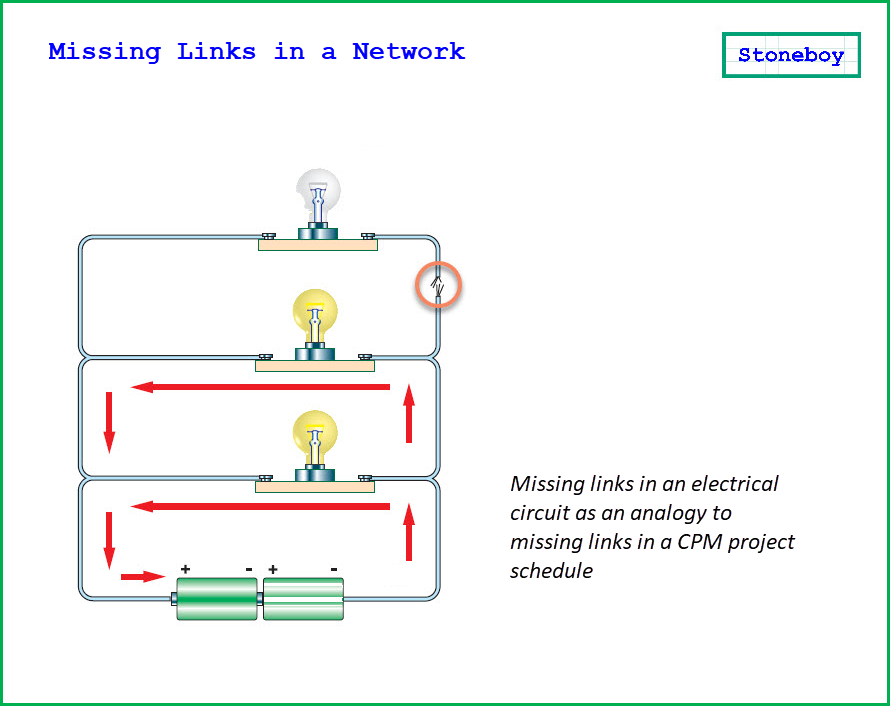
– there should be no missing predecessor and successor for each task except the first activity and last activity of the schedule. Activity that has no predecessor will make the activity start on the data date itself, and activity having no successor will become an open-ended activity with a high total float which also makes the critical path of the project to be invalid.
- Leads
– the term designates the overlapping time between two activities, this indicates the time that would be overlapped if a task starts a certain time before the finish date of its predecessor. This happens when the negative lag is used to make the successor activity start before the finish date of the predecessor. Having leads can negatively impact the critical path of the project schedule. Stoneboy would advise to not use negative lags.
- Lags
– are hidden delays in the project schedule, also they are the work days gap in between two activity relationships. It is also advised to just add another task in replace to the lag duration to avoid using lags to improve the critical path calculation. The DCMA advises that the lags in the schedule shouldn’t be greater than 5%.
- Relationship Type
– use of finish-to-start for each relationship is strongly advised by most schedulers that is why it is also the default relationship when you try to connect two activities. Also, the DCMA recommends that 90% of the relationships in the schedule be in FS or finish-to-start.
- Hard Constraints
– are the constraints identified as Mandatory Start and Mandatory Finish. These constraints can prevent the schedule to be logic-driven. Also, the DCMA recommends not exceeding more than 5% of hard constraints in a schedule.
- High Floa
– the total float represents each activity’s limit for delay without affecting negatively the project milestones or project completion. The best practice in scheduling is to have a total float lower than 44 days. Also, the DCMA recommends not exceeding more than 5% of the activities to have a total float of more than 44 days.
- Negative Float
– this indicates a delay in the project milestones/completion. When negative total float was shown in the schedule, flags should be raised that there should be mitigation or otherwise achieving the project milestone/completion will not be possible, DCMA advised for this metric is zero.
- High Duration
– duration represents the timeline of each activity from the time it starts until it is complete. The best practice in scheduling is to have an activity duration of not more than 44 days. Also, the DCMA recommends not having more than 5% of the activities have an original duration of more than 44 days.
- Invalid Dates
– these are dates that have a forecast start/finish in the past (before the data date/project status date) or actual start/finish in the future (after the data date/project status date). This metric is very critical and there should be no invalid dates in a schedule.
- Resources
– these are the resources loaded on each activity. However, this quality check will depend on the project requirement. Some of the schedules do not require any resource loading at all. However, if this is required in the project specification – all activities should be resource loaded.
- Missed Tasks
– these are the tasks that was fall behind the schedule. This also assists in measuring the project performance in comparison to the baseline schedule. A large number of missed tasks can be a result of poor planning in actual work. Also, the DCMA advises that number in question should not exceed 5%, once it exceeds 5%, a recovery plan is required.
- Critical Path Test
– This test assesses the integrity of the schedule logic or sequence of work. To do the critical path test, first, you need to identify the critical path (you can use the filter or just check the total float of the activity), then intentional addition of duration on 1 of the activity (i.e. if the duration is 10, you have to make it 610 – adding 600 in the original duration). The critical test will be passed once the project completion is extended by exactly 600 days. If not, this means that there is a broken logic that needs to be fixed.
- Critical Path Length Index (CPLI)
– this is a metric that measures the efficiency of completing the project on time. It is preferable that the CPLI is equal to 1.0 which means the project might be completed on time. CPLI below 1.0 indicated the project is inefficient, while CPLI that is above 1.0 shows that the project may be finished earlier than planned. The formula for CPLI is equal to (Critical Path Length + Total Float) / (Critical Path Length).
- Baseline Execution Index (BEI)
– is a metric for evaluating the schedule performance in comparison to the baseline schedule. Also, this is similar to calculating the Earned Value as it compares the number of completed activities to the number of activities to be completed by the project status date/data date. The formula for BEI is equal to (total number of tasks finished / (total number of tasks baselined to finish + tasks without baseline finish dates)). BEI is equal to 1.0 indicates that the project team performance is okay. BEI below 1.0 indicates project delay in terms of the number of activities completed in comparison to the baseline, while BEI above 1.0 shows that the project is ahead in terms of the number of activities completed in comparison to the baseline.
0 Comments